Network Probe Enterprise Version
Network Probe version 3 introduces an Enterprise Probe which can collect and display
traffic statistics from multiple remote probes spanning your entire organization
or enterprise.
The enterprise probe is really good news if you have deployed or plan to deploy multiple probes
across your networks. By installing an enterprise probe you can now have a total
overview of the traffic situtation on all your networks from one single user interface.
When logging in to the enterprise probe you will immediately see an overview of the
most active networks as well as all alarms that have been triggered on any of the
networks you are monitoring.
Please contact our sales department if you are interested in a license key for
Network Probe Enterprise.

[click to enlarge]
Single Probe Logon
There is no longer a need for logging into each individual probe you want to monitor.
You can now simply search for or select the probe you want and all the
detailed traffic statistics will be available, just as if you were logged on directly to that probe.

[click to enlarge]
Network Drilldown
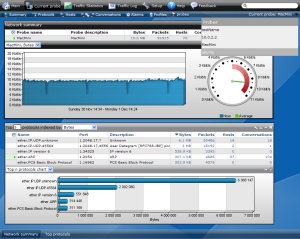
Selecting a probe from the top networks list you can drill down into more detailed traffic statistics
for that network such as the top protocols, talkers, and listeners. Simply do a right-click on the
probe entry and zoom in. The detailed statistics for that probe will then be displayed.

[click to enlarge]
Extensive Performance Improvements
Network Probe version 3 has had a total overhaul of the user interface code, and especially
the "Traffic Statistics" and "Traffic Log" has been improved multifold.
- The data loading time is dramatically shorter
- Scrolling through the data is a lot faster
- Searching, sorting, and filtering the data is a lot faster
- Dramatically reduced the memory usage, fixing problems with out of memory problems
Some of the work earlier performed by the probe on behalf of the client is now done on
the client side, leaving the probe free to collect and analyze the network data.
