
Network Probe Screenshots
Here is a collection of screenshots from Network Probe. Click on each screenshot for a full-size view. Click on the section titles for user manual details.
Main screen
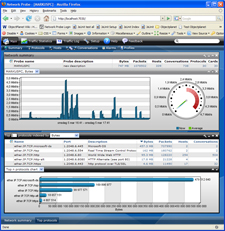
The main interface after logging in to Network Probe, displaying the network summary, and with easy access to the most active protocols, hosts, talkers, listeners, and conversations.
Using the top menu you can switch between the different parts of the application; the main screen, detailed live network statistics, logged historical traffic statistics, setup, and help.
The entire client application runs within a java-enabled web browser.
Statistics application overview
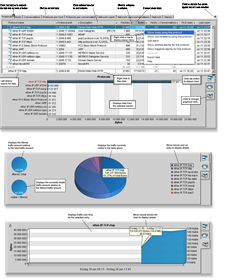
This screenshot compilation shows the application under the Traffic Statistics button.
Under each tab are detailed statistics for protocols, hosts, conversations, network cards, and the entire network segment.
The top half of each screen shows the detailed statistics in a searchable table and enables you to sort the traffic by packets and bytes, inbound and outbound traffic, as well as time of discovery.
The bottom half mirrors the data in the table graphically using bar and pie charts. It also displays the throughput over time for each entry in the table as a timeline chart.
Alarms
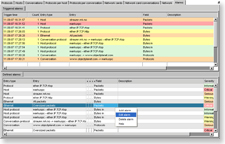
This screeen shows the display from the alarm tab, where all the defined and triggered alarms are displayed. Users can easily view, edit and delete both defined and triggered alarms using the alarms tab.
Profiles

This screen shows the profile manager. Using the profile manager profiles can be created, edited and deleted. Additionally the default and the active profile can be set. A profile stores the layout of the Main screens windows and tables. When a profile is activated the windows and tables are arranged as they where the last time the profile was saved.
Protocols
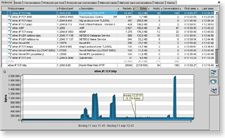
This screen shows the display from the protocols tab where all the protocols and their traffic details are displayed. The user has also selected the througput chart and the pop3 protocol and the traffic for this protocol over time is displayed.
Hosts
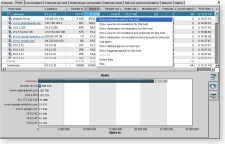
This screen shows the display from the hosts tab where all the hosts and their traffic details are displayed. The default chart is selected which mirrors the data in the table as a bar chart. The user has right-clicked the first entry and is about to drill down and show all the protocols used by the selected host.
Conversations
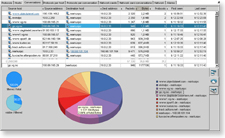
This screen shows the display from the conversations tab which lists all the conversations taking place on your network along with their detailed traffic statistics. The user has selecte the pie chart option which mirrors the data listed in the table.
Network cards
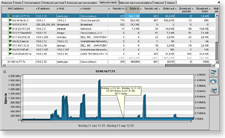
This screen shows the content of the network cards tab listing detailed statistics of all the active network cards on the network segment. The ethernet address, IP address, host name, and vendor is listed for each network interface, along with the inbound and outbound traffic amount.
Network traffic overview
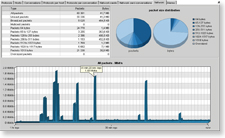
This screen shows the information from the network tab. The throughput for the entire network segment is displayed along with the breakup and throughput for each packet size group. Click on an entry to show the througput for it.
Detaching tabs
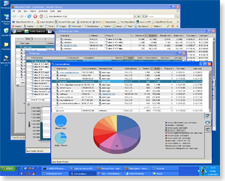
This screenshot shows how you can detach each tab of the statistics and log application into its own top-level application window so you can monitor and analyze protocols and host data all at the same screen. You can also detach the graphical charts, for instance you can always have a chart open for HTTP traffic to a specific host.
Data export
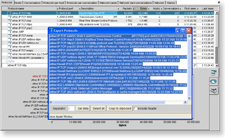
This screenshot shows how you can export traffic data directly from the user interface. This data can then be imported to excell or any data analysis tools.
Probe Setup
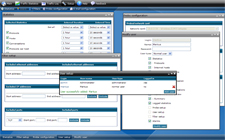
This screenshot shows the setup options for Network Probe. You can adjust the statistics collection settings, add, remove, or modify users, setup filters, control which network card data is collected from, and set up the license key.
Network Probe on Linux
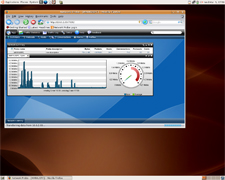
The client and server part of Network Probe does not need to run on the same computer. In fact, there is no client part to install as this is downloaded and run automatically when connecting to the probe. The client part runs on any java-enabled web browser, the server part on Windows, Linux, Mac OS X, FreeBSD, and Solaris.