Every chart type you need
EasyCharts supports a wide range of chart types and combinations, renowned by Java developers worldwide for its great feature set, flexibility, and ease of use.
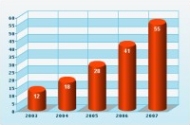
Bar & Column Charts
Create bar charts with multiple data series, configurations, styles and colors. Bars can be placed vertically or horizontally, side-by-side, stacked, or behind each other.
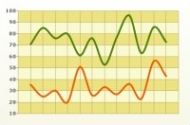
Line & Area Charts
Create line and area charts with different line styles, stacked data series, mouse-over labels, and sample point markers. Charts can be zoomed by dragging across the data.
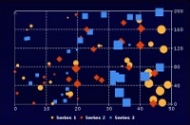
Plotter & Bubble Charts
Create a wide array of plotter and bubble charts with many different configurations. Set the size and shapes of the plots, or connect them to form data series.
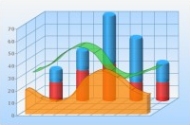
Combination Charts
Combine different bar, line, and area charts into new great-looking combination charts. There is no limit to the number of chart types that can be stacked on top of each other.
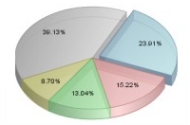
Pie Charts
Create 2D or 3D pie charts with multiple data series, detached pies, mouse-over labels, and drilldown functionality.
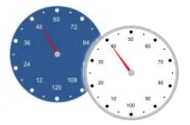
Gauge & Dial Charts
Gauge and dial charts let you create speedometer-style charts for network utilization, KPI monitoring, and other real-time applications.