Oslo, Norway, March 6th, 2008
Network Probe 2.7 was released and can now be downloaded:
Network Probe 2.7 Features
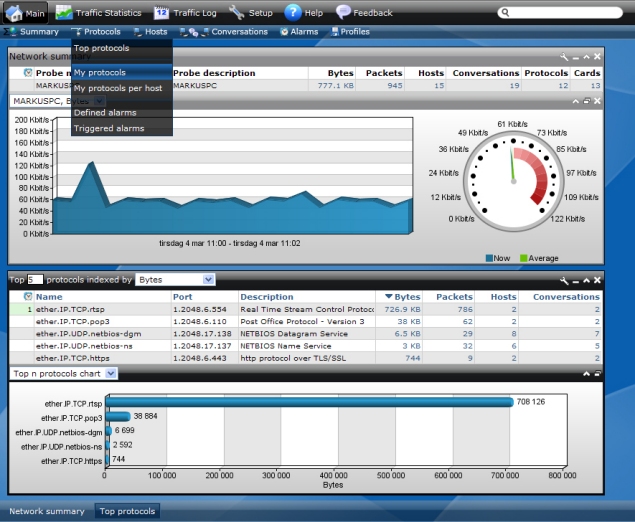
New look and feel
Network Probe 2.7 features an updated and improved user interface.
[click to enlarge]
Search
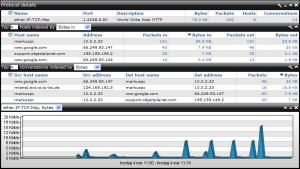
The search feature in the "Main" tab lets you easily and quickly find hosts and protocols of interest. While typing
in the search field Network Probe will suggest hosts and protocols found on your network. The entries suggested by
Network Probe are sorted by bytes.

[click to enlarge]
Once the host or protocol of interest is found, the entry can be added to the myProtocols or myHost table or a new
window can be opened to view the entries details. For hosts the detail window contains the top protocols used
by this host and the top conversations for the host. For a protocol the window contains the top hosts using this
protocol and the top conversations.
[click to enlarge]
Program alarm actions
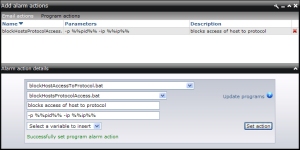
Network Probe 2.7 adds the possibility to run programs when alarms are triggered. You can also include
alarm details as parameters to the program.
[click to enlarge]
Program action library
Network Probe lets you add frequently used program alarm actions to an action library.
Actions in the action library can easily be added to new alarms later on.

[click to enlarge]
Status bar
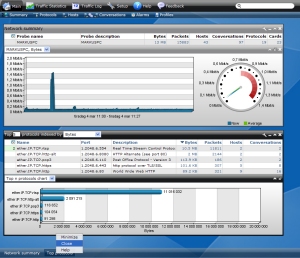
The status bar in Network Probe 2.7 makes managing multiple windows easy. The status bar can be used to minimize,
maximize or to close windows. Detached chart windows can also be attached to their parent window using the
status bar.
[click to enlarge]
Max gauge values
Gauges in Network Probe 2.7 can have a max value set. With no max value set the highest value in the gauge is the
statistics highest peak. By setting a max value the highest value in the gauge is not set higher than the set
max value.
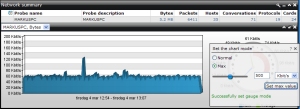
[click to enlarge]
Memory used in Network Probe service
Network 2.7 lets you specify the amount of memory that should be allocated to Network Probe when it is run as a server

[click to enlarge]
|
