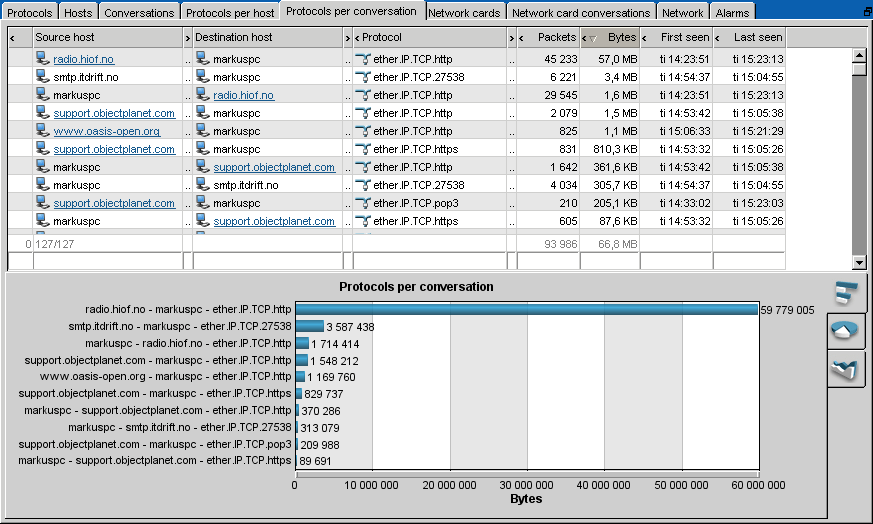
The protocols per conversation tab displays the type of traffic used by each conversation discovered on the network segment and the amount of traffic sent or received for each of these protocols.
The links on the source and destination host entries indicate addresses where HTTP traffic has occured. You can click on the links to open the address in a web page. Since the links only go to the root directory of the host, the page might not be valid or accessible.

triggered alarm count - the triggered alarm count for this entry color coded by the highest severity of the triggered alarms.
source host - the name of the host sending the data as discovered by dns lookup.
source_address - the IP address of the host sending the data. This column is hidden by default, click the arrow in the header to display the column.
destination host - the name of the host receiving the data as discovered by dns lookup.
source_address - the IP address of the host receiving the data. This column is hidden by default, click the arrow in the header to display the column.
protocol - the full name of the protocol. The name consists of the fully encapsulated name with the actual protocol being the last name. ether.IP.TCP.www-http is the HTTP protocol (web browsing) running on top of TCP running on top of IP running on top of Ethernet.
protocol port - the protocol ID and port number for the protocol. The protocol port consists of the protocol numbers and ports for the encapsulating protocols and the actual protocol port being the last number. In the protocol ID 1.2048.6.80, 1 defines Ethernet, 2048 (0x0800) is IP, 6 is TCP and 80 is the HTTP port number. This column is collapsed.
packets - the number of packets seen of a specific protocol for each conversation on the network segment since the probe started or was reset.
bytes - the amount of traffic seen of a specific protocol for each conversation on the network segment since the probe started or was reset.
first seen - the time the network probe first discovered this type of traffic for a conversation after the probe started or was reset.
last seen - the time the network probe last saw traffic of this type for a conversation after the probe started or was reset.
Protocols per conversation popup menu
The protocols per conversation poup menu is displayed if you right click an entry.

Show conversations using this protocol - this will display all conversations seen using the selected protocol since the probe started or was reset.
Show hosts using this protocol - this will display all the hosts that have sent or received data using the selected protocol since the probe started or was reset. The protocols per host tab will be displayed.
Show protocols used by this conversation - this will display all protocols used by the selected conversation since the probe started or was reset.
Show protocols used by source host - this will display all protocols used by the source host of the selected conversation since the probe started or was reset. The protocols per host tab will be displayed.
Show protocols used by destination host - this will display all protocols used by the destination host of the selected conversation since the probe started or was reset. The protocols per host tab will be displayed.
Add alarm - this will let you add an alarm for this protocol and conversation. The add alarm window will be displayed.
Show defined alarms for this protocol and conversation - this will display all the defined alarms for this protocol and conversation. The alarms tab will be displayed.
Show triggered alarms for this protocol and conversation - this will display all the triggered alarms for this protocol and conversation. The alarms tab will be displayed.