A poll is a simple survey, usually embedded as an integral part of a web page. It is normally one question, like a multiple choice question, with a button to send the response. Then after answering this question, the respondent can view an instant chart of the poll results, either in a popup-window, or a chart embedded in the page. Opinio provides all this functionality, and more.
With Opinio, you can even create advanced polls, with any question type, like a rating, text-fields, matrix etc. All question types available in a normal survey is also available in a poll. This is because a poll is actually a survey in Opinio. Technically they almost the same, the only difference is that a poll is displayed as an integral part of a web page, while a Survey is a web page (or multiple pages) in its own right. The limitation for a poll is usually screen space. Often the poll author is forced a simple question type, to make it fit into another web page.
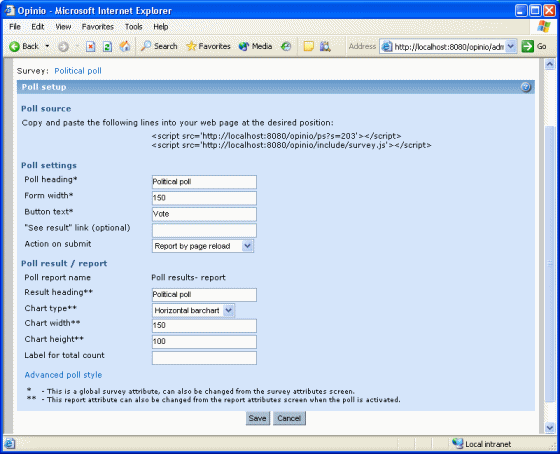
The poll setup screen is used to simplify the process of setting up a poll. Some of the poll attributes can also be set in the survey attributes screen, simply because a poll is actually a survey in Opinio.
NOTE: if you are editing a poll, and the poll is already published on your web page, the result/chart will be displayed on the web page, instead of the question form. This is because the poll (survey) will be locked while edited.
Survey and poll differences:
- A survey can have multiple pages, and the questions in a poll can only be displayed on a single page.
- Polls can not utilize Opinio's conditional branching functionality (only works on multiple-page surveys).
- Progress bar can not be used with polls (only works on multiple-page surveys).
- Surveys in Opinio supports user authentication - this is not available in a poll.
- Redirects to other web pages are only available in surveys, not polls.
- Invitation functionality does not work for polls. It is of course possible to invite people to your web page, but the build-in Opinio invitation functionality is only meant for use with full-blown surveys.
- Server-side validation of response data (answers) does not work in polls. Client-side validation is turned on by the poll setup-screen, but it is possible to turn it off in the survey setup screen. This should not be done, because it may prevent some responses from being stored (without the respondent being aware of it).
The poll setup screen has these elements:

- Warning message. This message is only shown the first time you enter the poll setup for the current survey.
- Poll source. When your poll is created, and all your settings are tweaked the way you want it, it should be ready to be published. Copy the two lines that start with "<script src=..", and paste them into the HTML code of your web page, at the position where you want the poll to appear. If you have two or more polls on your page, the second line only needs to appear once on your page.
- Poll heading. The top heading of your poll. This is the text placed at the top bar of your poll. This heading is optional.
- Form width. The width of the poll form, including the top/bottom bar..
- Button text. The label on the submit button. "Vote" is default. The vote button is the same survey attribute as the “start”-button in a survey. Changing this label, will change the “finish”-button label (look in the survey attributes screen).
- "See result" link (optional). If you want the respondents to have access to the chart without voting first, type in the label of the link here. The link to results will then be displayed to the left of the submit-button.
Action on submit. When the user has answered the question, and clicked on the vote-button, the value selected here determines what happens next:
- Report by JavaScript: This is perhaps the most elegant solution, where the result chart is calculated before the page with the poll is displayed. When the vote button is clicked, the response data is sent to the Opinio server, and the result chart is displayed immediately. What happens is actually a JavaScript function call that simply switches the view from the poll form to the poll chart. The result is always one behind, i.e. the vote for the current respondent is not included in the chart, because the chart is calculated on the initial page visit.
- Report by page reload: With this option, the page is submitted, the result chart is then calculated, and the same page is displayed with the chart. The disadvantage is that the page is submitted and must be reloaded, the advantage is up-to-date charts (includes the count for current respondent).
- Report by in popup window: This option will display the chart in a popup window, and leave the form embedded in the page unchanged. The chart will be updated with the current respondent.
- Thank you- note: This option will display the survey Thank you- note by switching the view with JavaScript.
- Result heading. The heading for the poll charts. It is optional.
- Chart type. There are 3 chart types available: Vertical bar, horizontal bar, and pie chart. The bar chart is good for showing the counts/distribution for all answers. The pie chart is best if you want to display the relative count for each answer compared with each other.
- Chart width. The width of chart, in pixels.
- Label for total count (optional). If you want the total number of votes to be displayed under the chart, type in the label for it here.
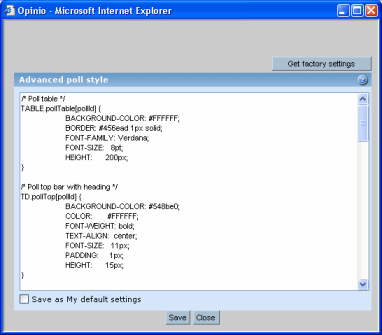
Advanced poll style. Most of the poll look & feel settings must be done through the CSS editor. This is a bit technical, and you should understand the basics of CSS before making changes here. Also, study the default settings - usually small changes are needed to make the poll look the way you want. Height/width and background-colors are usually enough.

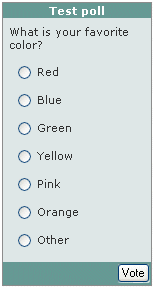
An example:
