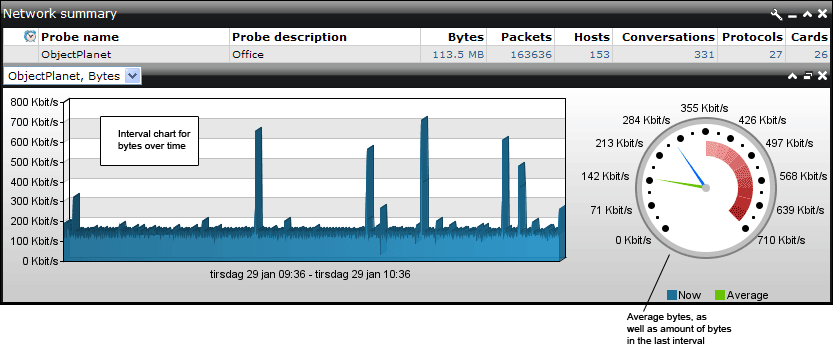
The summary window lets you monitor the total throughput, the number of packets, hosts, conversations, protocols and network cards on the network. Charts for bytes and packets consists of two charts, one line chart and one gauge chart. The line chart displays the bytes or packets over time, while the gauge chart shows the average amount of bytes or packets as well as the field's value in the last interval.

Interval charts for conversations, protocols and network cards are line charts and show the amount of conversations, protocols or network cards over time.

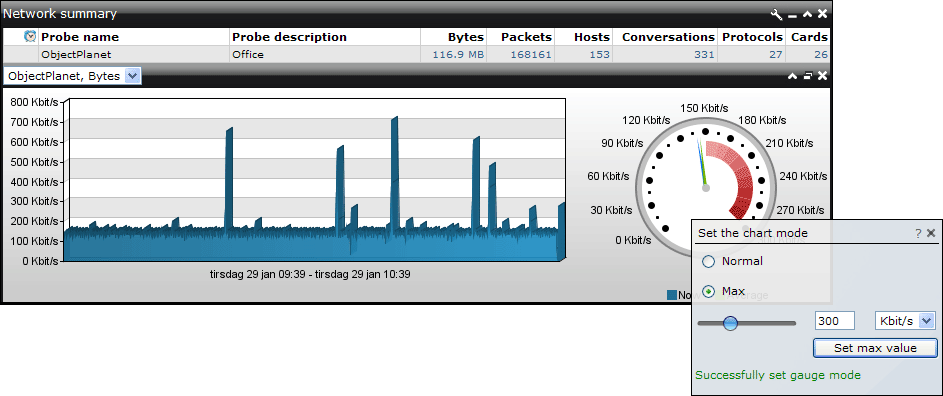
The gauge chart in the summary window shows the average and the amount of bytes or packets in the last interval. The max value of the gauge is set to the highest peak of bytes or packets per default. Right click on the gauge chart to configure the max value for the gauge. In normal mode the max value is set to the highest peak. By setting a max value the max value of the gauge is not set larger than the given max value. The gauges max value might be set lower than the set max value if the highest peak is smaller than the max value.

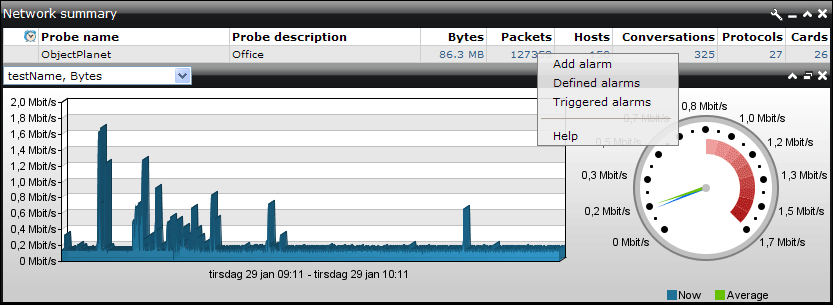
Summary windows right click menu
The summary window right click menu is shown when you right click a entry in the summary table.
Add alarms - this will open the add alarm window, and fill in the entry clicked on.
Defined alarms - this will open a window showing the defined alarms for this windows table.
Triggered alarms - this will open a window showing the triggered alarms for this windows table.
