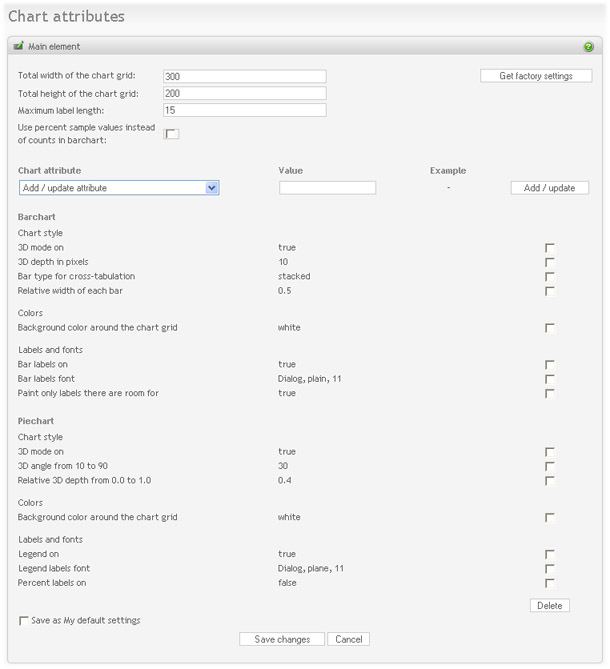
The chart attributes within an element can be customized in great detail. Changes made to the report element, only affects the current report element. The screen for editing the element's chart attributes (click on "Chart attributes" from the report element list):
The reports can be made simpler or more detailed depending on which option you turn on or off:
- Total width of the chart grid: The width, in pixels, of the produced chart image.
- Total height of the chart grid: The height, in pixels, of the produced chart image.
- Maximum label length: The number of characters in chart labels. The length of the chart labels should normally be limited, because if they are too long, the labels will consume all the space allocated for the chart image (see width/height above).
- Use percent sample values instead of counts in barchart: Select this to show the ratios (percents) instead of the actual counts for each value in a barchart.
The chart attributes for a report element is very flexible, but may seem complicated to inexperienced users. It is not required to make any changes here, unless you have specific requirements for your charting.
To edit or add a chart attribute, select the attribute you want to edit/change in the attribute drop-down list. An example value for this attribute is displayed to the right. Enter your desired value, and click the "add/update" button. If the attribute does not already exist, it will be added to this report element, otherwise it will be changed to the new value.
Available bar chart attributes:
-
Chart style
- 3D mode on: Values: true or false.
- 3D depth in pixels: The depth of the bar "shadow", in pixels. Example values are 5, 10, 20.
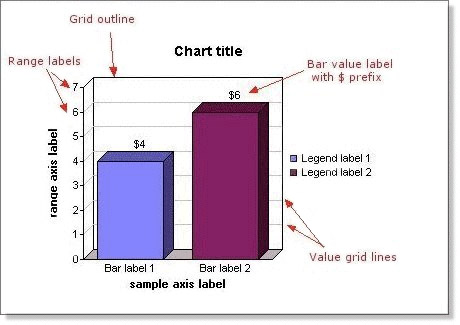
- Value grid lines on: Shows value guide-lines on the chart, to make it easier to read the value of the bars.
- Value grid lines color: Set the color of the grid lines. Values can be either colors like red, blue, or RGB-values like #FF0000, #3399FE, #3300FF. See color codes for details.
- Bar type for cross-tabulation: The bar chart for cross-tabulation reports can be shown as stacked, or side-by-side. Valid values: stacked, side
- Outline around the bars off: true, false
- Relative width of each bar: Sets the relative width of each bar. If the width is set to 1.0, there will be no space between the bars. If the width is set to 0.5, the space between each bar will be the same as the width of the bar.
-
Colors:
- Background color around the chart grid: See color codes for details on how to specify colors.
- Background: This is the background color of the chart itself. See color codes for details on how to specify colors.
- Grid outline color: The color of the chart grid outline, including the fonts. See color codes for details on how to specify colors.
- Display bars with different colors: Set value to either true or false
- Colors of the bars: Set all bars to the same color. See color codes for details on how to specify colors.
-
Labels and fonts:
- Title of the chart: The title shown at the top of the chart. Make sure there is room to display long titles.
- Chart title font: Sets the title font. Make sure the font specified is available on the server Opinio is installed on. Example values: “Arial, plain, 12”, “Verdana, bold, 10”
- Default font for chart labels: Example values: “Arial, plain, 12”, “Verdana, bold, 10”
- Bar labels on: Turns on the bar labels. The bar labels will be displayed below each bar in the chart. Values: true or false
- Bar labels clockwise angle: Angle of the bar labels. Sample value: 270
- Bar labels font: Example values: “Arial, plain, 12”, “Verdana, bold, 10”
- Legend on: Turns the legend on/off. Values: true or false
- Legend position: If the legend is turned on, these are possible values: left, right, top or bottom
- Legend labels font: Example values: “Arial, plain, 12”, “Verdana, bold, 10”
- Bar value labels on: The labels on bars (usually counts or percents). Values: true or false
- Value labels clockwise angle: The angle for labels on the bars. Sample value: 270
- Value labels prefix: Sample value: $
- Value labels postfix: Sample value: USD
- Range labels off: Range labels are the labels along the axis, displaying the value range. Values: true or false
- Upper value of the range axis: Specify the upper numeric value for the range axis.
- Range axis label: Specify the label for the range axis.
- Range axis label clockwise angle: Sample value: 270
- Range axis label font: Example values: “Arial, plain, 12”, “Verdana, bold, 10”
- Sample axis label: Specify the label of the sample axis.
- Sample axis font: Example values: “Arial, plain, 12”, “Verdana, bold, 10”
- Sample axis clockwise angle: Sample value: 270
- Paint only labels there are room for: By default all the bar labels are painted even if there is not enough space for them all (they will overlap). If this parameter is set to true, only labels there are room for will be painted.
Available pie chart attributes:
-
Chart style
- 3D mode on: Values: true or false.
- 3D angle from 10 to 90: Angle of the pie, if 3D mode is on. Example values are 20, 35.
- Slice separator on: Displays a line between the slices in a pie.
- Slice separator color: See color codes for details on how to specify colors.
-
Colors
- Background color around the chart grid: See color codes for details on how to specify colors.
-
Labels and fonts
- Title of the chart: The title shown at the top of the chart. Make sure there is room to display long titles.
- Chart title font: Sets the title font. Make sure the font specified is available on the server Opinio is installed on. Example values: “Arial, plain, 12”, “Verdana, bold, 10”
- Default font for chart labels: Example values: “Arial, plain, 12”, “Verdana, bold, 10”
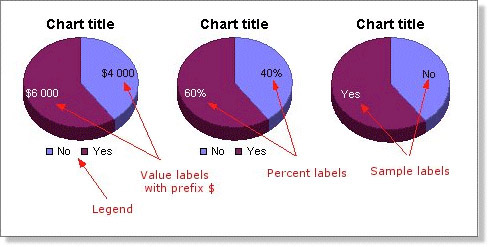
- Legend on: Turns the legend on/off. Values: true or false
- Legend position: If the legend is turned on, these are possible values: left, right, top or bottom
- Legend labels font: Example values: “Arial, plain, 12”, “Verdana, bold, 10”
- Percent labels on: Shows the percent of total for each slice. Values: true or false
- Sample labels on: Specify if the sample labels should be displayed. Values: true or false
- Value labels on: Specify if the value labels should be displayed. Values: true or false
- Value labels prefix: Sample value: $
- Value labels postfix: Sample value: USD
- Font for sample / value / percent labels: Example values: “Arial, plain, 12”, “Verdana, bold, 10”
- Color for sample / value / percent labels: See color codes for details on how to specify colors.