1 Loading Data
Data can be loaded using the applet parameters.
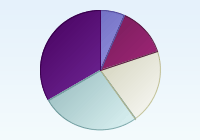
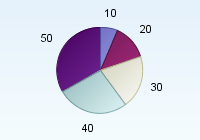
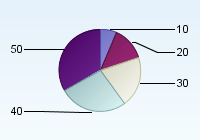
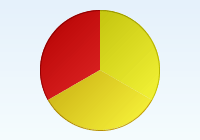
Use the sampleValues parameter to load data into the applet. The applet code below creates a pie chart and loads the values 10,20,30,40, and 50. The sample count of the chart will equal the number of values in the sampleValues parameter.
<applet code=com.objectplanet.chart.ChartApplet
archive=chart.jar width=200 height=140>
<param name=chart value="pie">
<param name=sampleValues value="10,20,30,40,50">
</applet>
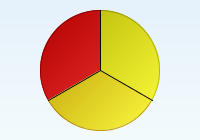
You can set the sample count explisitly by using the sampleCount parameter. The chart below sets the sample count to 10, but only sets the 5 first samples.
<applet code=com.objectplanet.chart.ChartApplet
archive=chart.jar width=200 height=140>
<param name=chart value="pie">
<param name=sampleCount value="10">
<param name=sampleValues value="10,20,30,40,50">
</applet>
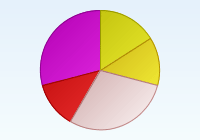
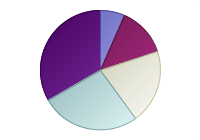
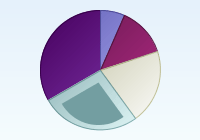
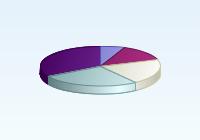
You can have empty values by using an undefined number (any sign that's not a valid number).
<applet code=com.objectplanet.chart.ChartApplet
archive=chart.jar width=200 height=140>
<param name=chart value="pie">
<param name=sampleValues value="10,20,x,40,50">
</applet>
![]()
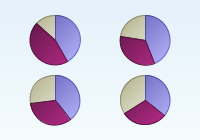
A chart can have multiple data series. When the chart has multiple data series the number of pies will equal the number of samples, and the number of segments per pie will equal the number of data series.
Use the seriesCount parameter to control the number of data series, and the sampleValues_N parameter to set the values per data series.
<applet code=com.objectplanet.chart.ChartApplet
archive=chart.jar width=200 height=140>
<param name=chart value="pie">
<param name=seriesCount value=3>
<param name=sampleValues_0 value="72,87,65,78">
<param name=sampleValues_1 value="79,67,54,65">
<param name=sampleValues_2 value="23,45,45,74">
</applet>
Since the applet can not connect directly to a data source, any data that has to be loaded dynamically has to be generated on the server side.
Use a scripting language on the web server (such as ASP) to read the data
from a data base (or any other data source) and construct the applet
code using the values read. Then the web page is sent to the client
with the dynamically data ready to load into the applet.
<%
'## this function prints out the count for each department separated by comma
function PrintDepartmentCount(ByRef employeeRS)
   While Not employeeRS.EOF
      Response.Write employeeRS("DepartmentCount") & ","
      employeeRS.MoveNext
   Wend
end function

'## open data connection
set DbConn=server.createobject("adodb.connection")
cnpath="DBQ=" & server.mappath("employees.mdb")
'Response.Write cnpath
DbConn.Open "DRIVER={Microsoft Access Driver (*.mdb)}; " & cnpath

'## Let's say we have one table with employees. One of the columns
'## is the department name, and the table name is employee

'## The following lines gets the number of employees for each department
Sql = "SELECT COUNT(*) AS DepartmentCount, Department
FROM Employee GROUP BY Department ORDER BY Department"
Set employeeRS = DbConn.Execute(Sql)
%>

<applet code=com.objectplanet.chart.ChartApplet
 archive=chart.jar width=640 height=200>
<param name=chart value="pie">
<param name=sampleValues value="<%call PrintDepartmentCount(employeeRS)%>">
</applet>
See here for full ASP example.
If you want to load the applet or servlet data and parameters from a url, you need specify the url in the data parameter in your applet or servlet tag as below
Applet:
<applet code=com.objectplanet.chart.PieChartApplet
archive=Chart.jar width=200 height=140>
<param name=data value="parameters.data">
</applet>
You can also configure the applet to load data from the currently specified data URL at a specific interval.
<applet code=com.objectplanet.chart.PieChartApplet
archive=Chart.jar width=200 height=140>
<param name=data value="parameters.data">
<param name=dataInterval value="10">
</applet>
The above applet will reload the parameters.data file at 10 second intervals. If you specify a new data parameter in the parameters.data file, this file will be loaded instead on the next interval.
<param name=dataInterval value="10,reset">
This will make the applet reset all it's data before the new data is loaded.
Servlet:
<img src="http://localhost:8080/servlet/com.objectplanet.chart.ChartServlet?
chart=pie&
width=200&
height=140&
data=http://somehost/parameters.data">
Only an applet can load the data from a URL. The parameters.data file looks like this:
sampleValues_0=47,38,85,36,85
sampleColors=yellow, orange, pink, red, magenta
The data url can point to a script that produces the data as long as the format returned is as in the example above.
If you need to pass parameters to the script when using servlets, & for parameter separation and = for parameter value assignment can not be used. Instead you need to use � as the parameter separator and * for the equals sign.
<img src="http://localhost:8080/servlet/com.objectplanet.chart.ChartServlet?
chart=pie&
width=200&
height=140&
data=http://somehost/somescript.xyz?myparam*value�anotherparam*anothervalue&
background=white">
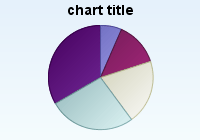
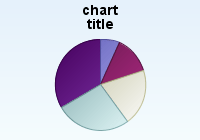
The chartTitle parameter adds a label at the top center of the chart.
<applet code=com.objectplanet.chart.ChartApplet
archive=chart.jar width=200 height=140>
<param name=chart value="pie">
<param name=sampleValues value="10,20,30,40,50">
<param name=chartTitle value="chart title">
</applet>
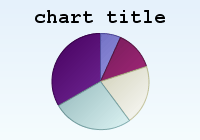
You can have multiline labels by using a \n (goes for all chart labels).
<applet code=com.objectplanet.chart.ChartApplet
archive=chart.jar width=200 height=140>
<param name=chart value="pie">
<param name=sampleValues value="10,20,30,40,50">
<param name=chartTitle value="chart\ntitle">
</applet>
The titleFont parameter sets the font used for the title.
<applet code=com.objectplanet.chart.ChartApplet
archive=chart.jar width=200 height=140>
<param name=chart value="pie">
<param name=sampleValues value="10,20,30,40,50">
<param name=chartTitle value="chart title">
<param name=titleFont value="Courier, bold, 20">
</applet>
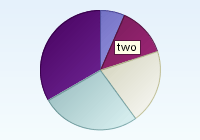
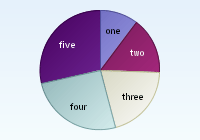
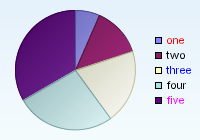
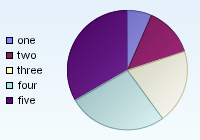
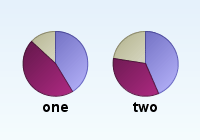
You can add a label to each pie segment in the chart by using the sampleLabels parameter. The sample labels can either be displayed floating above each pie segment when the mouse moves over (default), statically inside each pie slice, or in the legend.
Turn on the sample labels using the sampleLabelsOn paramter.
<applet code=com.objectplanet.chart.ChartApplet
archive=chart.jar width=200 height=140>
<param name=chart value="pie">
<param name=sampleValues value="10,20,30,40,50">
<param name=sampleLabels value="one,two,three,four,five">
<param name=sampleLabelsOn value=true>
</applet>
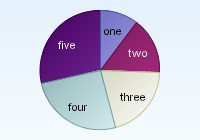
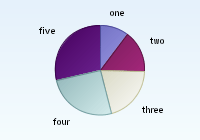
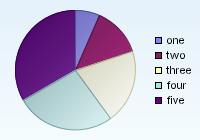
Use the sampleLabelStyle parameter to control how the labels are displayed. For labels inside the pie slices, use "inside", for floating labels, use "floating".
<applet code=com.objectplanet.chart.ChartApplet
archive=chart.jar width=200 height=140>
<param name=chart value="pie">
<param name=sampleValues value="10,15,20,25,28">
<param name=sampleLabels value="one,two,three,four,five">
<param name=sampleLabelsOn value=true>
<param name=sampleLabelStyle value=inside>
</applet>
Use the insideLabelFont parameter to control the font used for the static labels displayed inside each pie slice.
<applet code=com.objectplanet.chart.ChartApplet
archive=chart.jar width=200 height=140>
<param name=chart value="pie">
<param name=sampleValues value="10,15,20,25,28">
<param name=sampleLabels value="one,two,three,four,five">
<param name=sampleLabelsOn value=true>
<param name=sampleLabelStyle value=inside>
<param name=insideLabelFont value="Arial, plain, 9">
</applet>
Use the floatingLabelFont parameter to control the font used for the floating labels.
<applet code=com.objectplanet.chart.ChartApplet
archive=chart.jar width=200 height=140>
<param name=chart value="pie">
<param name=sampleValues value="10,20,30,40,50">
<param name=sampleLabels value="one,two,three,four,five">
<param name=sampleLabelsOn value=true>
<param name=floatingLabelFont value="Arial, bold, 16">
</applet>
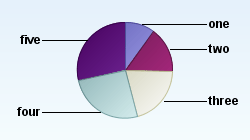
Use sampleLabelStyle=outside to show sample labels outside the pie.
<applet code=com.objectplanet.chart.ChartApplet
archive=chart.jar width=200 height=140>
<param name=chart value="pie">
<param name=sampleValues value="10,15,20,25,28">
<param name=sampleLabels value="one,two,three,four,five">
<param name=sampleLabelsOn value=true>
<param name=sampleLabelStyle value=outside>
<param name=outsideLabelFont value="Arial, plain, 9">
</applet>
Use sampleLabelStyle=pointing to show sample labels pointing to the slices.
<applet code=com.objectplanet.chart.ChartApplet
archive=chart.jar width=250 height=140>
<param name=chart value="pie">
<param name=sampleValues value="10,15,20,25,28">
<param name=sampleLabels value="one,two,three,four,five">
<param name=sampleLabelsOn value=true>
<param name=sampleLabelStyle value=pointing>
<param name=pointingLabelFont value="Arial, bold, 12">
</applet>
Use the sampleLabelColors to control the color of the sample labels
in the legend.
<applet code=com.objectplanet.chart.ChartApplet
archive=chart.jar width=200 height=140>
<param name=chart value="pie">
<param name=sampleValues value="10,20,30,40,50">
<param name=sampleLabels value="one,two,three,four,five">
<param name=sampleLabelColors value="red, black, blue, black, magenta">
<param name=legendOn value="true">
</applet>
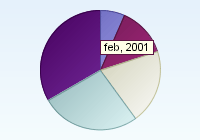
The default label field delimiter used is comma (,). If you want commas
in your labels, you need to set a different label field delimiter.
The label delimiter has effect on the sample labels, series labels,
and legend labels.
<applet code=com.objectplanet.chart.ChartApplet
archive=chart.jar width=200 height=140>
<param name=chart value="pie">
<param name=sampleValues value="10,20,30,40,50">
<param name=labelDelimiter value=":">
<param name=sampleLabels value="jan, 2001:feb, 2001:mar, 2001:apr, 2001:may, 2001">
<param name=sampleLabelsOn value=true>
</applet>
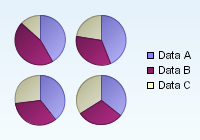
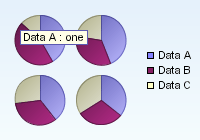
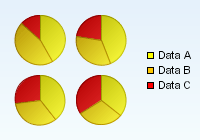
When using multiple data series you set a label for each data series using the seriesLabels parameter. The legend will display the series labels instead of the sample labels as in a chart with one data series.
<applet code=com.objectplanet.chart.ChartApplet
archive=chart.jar width=200 height=140>
<param name=chart value="pie">
<param name=seriesCount value=3>
<param name=sampleValues_0 value="72,87,65,78">
<param name=sampleValues_1 value="79,67,54,65">
<param name=sampleValues_2 value="23,45,45,74">
<param name=seriesLabels value="Data A,Data B,Data C">
<param name=legendOn value=true>
</applet>
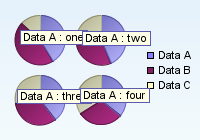
Use the seriesLabelsOn parameter to turn on floating series labels. When using multiple data series you set a label for each data series using the seriesLabels parameter. The legend will display the series labels instead of the sample labels as in a chart with one data series.
<applet code=com.objectplanet.chart.ChartApplet
archive=chart.jar width=200 height=140>
<param name=chart value="pie">
<param name=seriesCount value=3>
<param name=sampleValues_0 value="72,87,65,78">
<param name=sampleValues_1 value="79,67,54,65">
<param name=sampleValues_2 value="23,45,45,74">
<param name=sampleLabels value="one,two,three,four">
<param name=sampleLabelsOn value=true>
<param name=seriesLabels value="Data A,Data B,Data C">
<param name=seriesLabelsOn value=true>
<param name=legendOn value=true>
</applet>
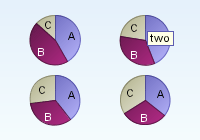
Use seriesLabelStyle to display the series labels inside the pie slices.
<applet code=com.objectplanet.chart.ChartApplet
archive=chart.jar width=200 height=140>
<param name=chart value="pie">
<param name=seriesCount value=3>
<param name=sampleValues_0 value="72,87,65,78">
<param name=sampleValues_1 value="79,67,54,65">
<param name=sampleValues_2 value="23,45,45,74">
<param name=sampleLabels value="one,two,three,four">
<param name=sampleLabelsOn value=true>
<param name=seriesLabels value="A,B,C">
<param name=seriesLabelsOn value=true>
<param name=seriesLabelStyle value=inside>
</applet>
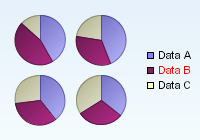
Use the seriesLabelColors to set the colors of the series labels in the legend.
<applet code=com.objectplanet.chart.ChartApplet
archive=chart.jar width=200 height=140>
<param name=chart value="pie">
<param name=seriesCount value=3>
<param name=sampleValues_0 value="72,87,65,78">
<param name=sampleValues_1 value="79,67,54,65">
<param name=sampleValues_2 value="23,45,45,74">
<param name=seriesLabels value="Data A,Data B,Data C">
<param name=seriesLabelColors value="black, red, black">
<param name=legendOn value=true>
</applet>
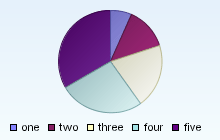
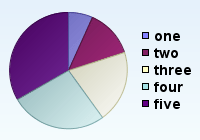
The legend is turned on using the legendOn parameter.
<applet code=com.objectplanet.chart.ChartApplet
archive=chart.jar width=200 height=140>
<param name=chart value="pie">
<param name=sampleValues value="10,20,30,40,50">
<param name=sampleLabels value="one,two,three,four,five">
<param name=legendOn value=true>
</applet>
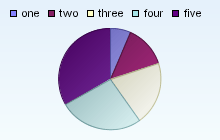
The legend position is controlled using the legendPosition parameter. The position can be right (default), left, top, or bottom.
<applet code=com.objectplanet.chart.ChartApplet
archive=chart.jar width=220 height=140>
<param name=chart value="pie">
<param name=sampleValues value="10,20,30,40,50">
<param name=sampleLabels value="one,two,three,four,five">
<param name=legendOn value=true>
<param name=legendPosition value=left>
</applet>
Control the font used for the legend labels using the legendLabels parameter.
<applet code=com.objectplanet.chart.ChartApplet
archive=chart.jar width=200 height=140>
<param name=chart value="pie">
<param name=sampleValues value="10,20,30,40,50">
<param name=sampleLabels value="one,two,three,four,five">
<param name=legendOn value=true>
<param name=legendFont value="Arial, bold, 14">
</applet>
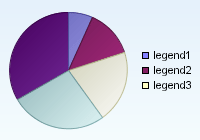
By default the legend contains the sample labels when one data series is used or the series labels when multiple data series is used. You can override this by using the legendLabels parameter.
<applet code=com.objectplanet.chart.ChartApplet
archive=chart.jar width=200 height=140>
<param name=chart value="pie">
<param name=sampleValues value="10,20,30,40,50">
<param name=sampleLabels value="one,two,three,four,five">
<param name=sampleLabelsOn value=true>
<param name=legendLabels value="legend1,legend2,legend3">
<param name=legendOn value=true>
</applet>
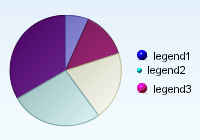
Any legend box may be replaced by an image.
<applet code=com.objectplanet.chart.ChartApplet
archive=chart.jar width=200 height=140>
<param name=chart value="pie">
<param name=sampleValues value="10,20,30,40,50">
<param name=sampleLabels value="one,two,three,four,five">
<param name=sampleLabelsOn value=true>
<param name=legendLabels value="legend1,legend2,legend3">
<param name=legendOn value=true>
<param name=legendImage_0 value="images/blue-ball.gif">
<param name=legendImage_1 value="images/cyan-ball-small.gif">
<param name=legendImage_2 value="images/magenta-ball.gif">
</applet>
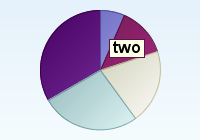
Turn on the value labels using the valueLabelsOn parameter. The value labels is displayed floating above each pie segment when the mouse moves over it.
<applet code=com.objectplanet.chart.ChartApplet
archive=chart.jar width=200 height=140>
<param name=chart value="pie">
<param name=sampleValues value="10,20,30,40,50">
<param name=valueLabelsOn value="true">
</applet>
Use the valueLabelStyle parameter to display the value labels statically inside each pie slice, outside each pie slice or pointing to the pie slices.
<applet code=com.objectplanet.chart.ChartApplet
archive=chart.jar width=200 height=140>
<param name=chart value="pie">
<param name=sampleValues value="10,20,30,40,50">
<param name=valueLabelsOn value="true">
<param name=valueLabelStyle value="inside">
</applet>

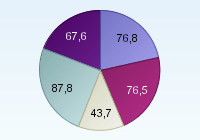
Use the sampleDecimalCount parameter to control the number of decimals used for the value labels.
<applet code=com.objectplanet.chart.ChartApplet
archive=chart.jar width=200 height=140>
<param name=chart value="pie">
<param name=sampleValues value="76.8, 76.5, 43.7, 87.8, 67.6">
<param name=valueLabelsOn value="true">
<param name=valueLabelStyle value="inside">
<param name=sampleDecimalCount value="1">
</applet>
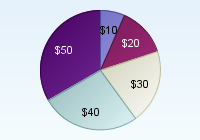
You can add a prefix and postfix to the value labels using the valueLabelPrefix and valueLabelPostfix parameters.
<applet code=com.objectplanet.chart.ChartApplet
archive=chart.jar width=200 height=140>
<param name=chart value="pie">
<param name=sampleValues value="10,20,30,40,50">
<param name=valueLabelsOn value="true">
<param name=valueLabelStyle value="inside">
<param name=valueLabelPrefix value="$">
</applet>
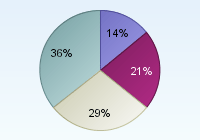
Use the percentLabelsOn parameter to turn on floating percent labels.
<applet code=com.objectplanet.chart.ChartApplet
archive=chart.jar width=200 height=140>
<param name=chart value="pie">
<param name=sampleValues value="10,20,30,40,50">
<param name=percentLabelsOn value="true">
</applet>

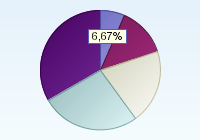
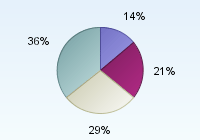
Use the percentDecimalCount to control the number of decimals used for the percent labels.
<applet code=com.objectplanet.chart.ChartApplet
archive=chart.jar width=200 height=140>
<param name=chart value="pie">
<param name=sampleValues value="10,20,30,40,50">
<param name=percentLabelsOn value="true">
<param name=percentDecimalCount value="2">
</applet>
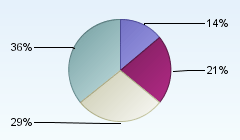
Use the percentLabelStyle parameter to display the percent labels statically inside each pie slice.
<applet code=com.objectplanet.chart.ChartApplet
archive=chart.jar width=200 height=140>
<param name=chart value="pie">
<param name=sampleValues value="20,30,40,50">
<param name=percentLabelsOn value="true">
<param name=percentLabelStyle value="inside">
</applet>
If multiple data series are used in the chart the sample labels can be displayed below each pie by turning the pieLabelsOn parameter.
Use the pieLabelFont parameter to set the font for these labels.
<applet code=com.objectplanet.chart.ChartApplet
archive=chart.jar width=200 height=140>
<param name=chart value="pie">
<param name=seriesCount value=3>
<param name=sampleValues_0 value="72,87,65,78">
<param name=sampleValues_1 value="79,67,54,65">
<param name=sampleValues_2 value="23,45,45,74">
<param name=sampleLabels value="one,two,three,four">
<param name=pieLabelsOn value=true>
<param name=pieLabelFont value="Arial, bold, 14">
</applet>
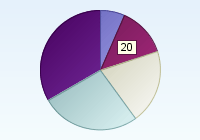
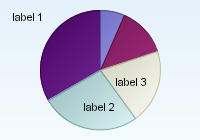
You can set any label at any place by using label_N parameter. The parameter takes absolute or relative coordinates.
<applet code=com.objectplanet.chart.ChartApplet
width=200 height=140>
<param name=chart value="pie">
<param name=sampleValues value="10,20,30,40,50">
<param name=label_0 value="label 1, 10, 20">
<param name=label_1 value="label 2, 0.5, 0.8">
<param name=label_2 value="label 3, 0.7, 0.6">
</applet>
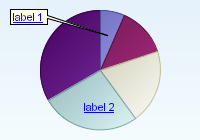
The label can point to any sample if you specify the index and series of the sample. In this case the label can be dragged using the mouse.
<applet code=com.objectplanet.chart.ChartApplet
width=200 height=140>
<param name=chart value="pie">
<param name=sampleValues value="10,20,30,40,50">
<param name=label_0 value="label 1, 10, 20, 4, 0">
<param name=label_1 value="label 2, 0.5, 0.8">
</applet>
![]()
An URL adress can be assigned to a label using labelURL_N parameter. In this case a new web page is opened when user clicks the label.
<applet code=com.objectplanet.chart.ChartApplet
width=200 height=140>
<param name=chart value="pie">
<param name=sampleValues value="10,20,30,40,50">
<param name=label_0 value="label 1, 10, 20, 0, 0">
<param name=label_1 value="label 2, 0.5, 0.8">
<param name=labelURL_0 value="objectplanet.com">
<param name=labelURL_1 value="www.objectplanet.com/EasyCharts">
</applet>
Use the sampleColors parameter to set the colors of the pie slices. If you have multiple data series, the sampleColors will set the color for each data serie. You can use the color names or html hex codes for the colors as in the example below.
<applet code=com.objectplanet.chart.ChartApplet
archive=chart.jar width=200 height=140>
<param name=chart value="pie">
<param name=sampleValues value="20,25,30,35">
<param name=sampleColors value="yellow, orange, red, #c00000">
</applet>
If you have multiple data series, the colors set is per data serie.
<applet code=com.objectplanet.chart.ChartApplet
archive=chart.jar width=200 height=140>
<param name=chart value="pie">
<param name=seriesCount value=3>
<param name=sampleValues_0 value="72,87,65,78">
<param name=sampleValues_1 value="79,67,54,65">
<param name=sampleValues_2 value="23,45,45,74">
<param name=sampleColors value="yellow, orange, red">
<param name=seriesLabels value="Data A,Data B,Data C">
<param name=legendOn value="true">
</applet>
Set the chart component background color using the background parameter.
<applet code=com.objectplanet.chart.ChartApplet
archive=chart.jar width=200 height=140>
<param name=chart value="pie">
<param name=sampleValues value="10,20,30,40,50">
<param name=background value="white">
</applet>
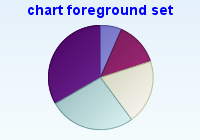
Set the chart component foreground color using the foreground parameter.
<applet code=com.objectplanet.chart.ChartApplet
archive=chart.jar width=200 height=140>
<param name=chart value="pie">
<param name=sampleValues value="10,20,30,40,50">
<param name=foreground value="blue">
<param name=chartTitle value="chart foreground set">
</applet>
Through the applet parameters you can control how the chart is displayed.
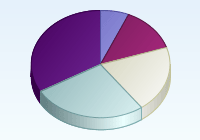
Turn on 3D mode with the 3DModeOn parameter.
<applet code=com.objectplanet.chart.ChartApplet
archive=chart.jar width=200 height=140>
<param name=chart value="pie">
<param name=sampleValues value="10,20,30,40,50">
<param name=3DModeOn value="true">
</applet>
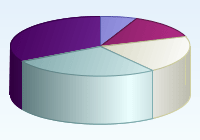
Set the 3D display angle by using the angle parameter. Valid value range for the angle parameters is 10-90. Default is 30.
<applet code=com.objectplanet.chart.ChartApplet
archive=chart.jar width=200 height=140>
<param name=chart value="pie">
<param name=sampleValues value="10,20,30,40,50">
<param name=3DModeOn value="true">
<param name=angle value="60">
</applet>
Set the 3D display depth by using the depth parameter. The depth is relative to the width of the pie and ranges from 0.0-1.0. The default depth is 0.4.
<applet code=com.objectplanet.chart.ChartApplet
archive=chart.jar width=200 height=140>
<param name=chart value="pie">
<param name=sampleValues value="10,20,30,40,50">
<param name=3DModeOn value="true">
<param name=angle value="60">
<param name=depth value="0.1">
</applet>

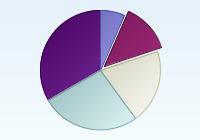
By default when a pie slice is selected, the slice is marked with a triangle inside the pie slice. You can control this selection marker by using the selectionStyle parameter.
The different styles are triangle, circle, or detached.
<applet code=com.objectplanet.chart.ChartApplet
archive=chart.jar width=200 height=140>
<param name=chart value="pie">
<param name=sampleValues value="10,20,30,40,50">
<param name=selectionStyle value="circle">
</applet>


You can detach pie slices using the detachedSlices and detachedSlices_N parameter (where N is the pie index).
<applet code=com.objectplanet.chart.ChartApplet
archive=chart.jar width=200 height=140>
<param name=chart value="pie">
<param name=sampleValues value="10,20,30,40,50">
<param name=detachedSlices value="0,2">
</applet>
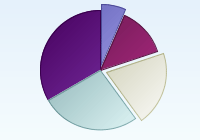
You can control the distance a pie slice is detached using the detachedDistance parameter. The detach distance is relative to the pie size with a value of 1.0 being detached fully.
<applet code=com.objectplanet.chart.ChartApplet
archive=chart.jar width=200 height=140>
<param name=chart value="pie">
<param name=sampleValues value="10,20,30,40,50">
<param name=detachedSlices value="1">
<param name=detachedDistance value="0.25">
</applet>
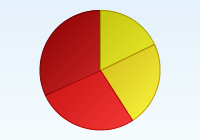
By default a seperator line is displayed between each pie slice. You can turn this off by turning the sliceSeperatorOn parameter to off.
<applet code=com.objectplanet.chart.ChartApplet
archive=chart.jar width=200 height=140>
<param name=chart value="pie">
<param name=sampleValues value="10,10,10">
<param name=sliceSeperatorOn value="false">
</applet>
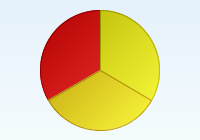
By default, the color of the slice seperator is a hint darker than the pie slices it seperates. You can control the color of the seperators using the sliceSeperatorColor parameter.
<applet code=com.objectplanet.chart.ChartApplet
archive=chart.jar width=200 height=140>
<param name=chart value="pie">
<param name=sampleValues value="10,10,10">
<param name=sliceSeperatorColor value="black">
</applet>
You can add a URL or javascript call to any pie slice or data series in the chart and have the applet open a new web page when the user double-clicks the slice or legend entry. You must include the MAYSCRIPT parameter in the applet tag if you want to call javascript functions.
Have the url point to a web page containing another chart to create drilldown charts.
<applet code=com.objectplanet.chart.ChartApplet
archive=chart.jar width=200 height=140 MAYSCRIPT>
<param name=chart value="pie">
<param name=sampleValues value="10,20,30,40,50">
<param name=url_0 value="chart1.html">
<param name=url_1 value="chart2.html">
<param name=url_2 value="javascript:winOpen('pie.html', 200,500);">
</applet>
The parameter url_0 adds a URL to the first slice in the above example. Use the parameter url to add a default url to all the samples.
In a chart having multiple data series, the url_N parameter adds a url to series N. The parameter url_N_M adds a url to sample M in data series N.
<applet code=com.objectplanet.chart.ChartApplet
archive=chart.jar width=200 height=140>
<param name=chart value="pie">
<param name=seriesCount value="2">
<param name=sampleValues_0 value="10,20,30,40,50">
<param name=sampleValues_1 value="20,30,40,50,60">
<param name=url_0_0 value="chart1.html">
<param name=url_1_0 value="chart2.html">
</applet>
You can also set the URLs programatically by calling setParameter("url_0", "myurl");
You can put a URL label to any place in the chart and have applet open a new web page when user clicks the label.
<applet code=com.objectplanet.chart.ChartApplet
archive=chart.jar width=300 height=200>
<param name=chart value="pie">
<param name=sampleValues value="10,20,30,40,50">
<param name=multiColorOn value=true>
<param name=label_0 value="url one, 35, 30">
<param name=label_1 value="url two, 85, 90">
<param name=label_2 value="url three, 140, 60">
<param name=label_3 value="url four, 190, 120">
<param name=label_4 value="url five, 245, 150">
<param name=labelURL_0 value="bar_url_sub.html#one">
<param name=labelURL_1 value="bar_url_sub.html#two">
<param name=labelURL_2 value="bar_url_sub.html#three">
<param name=labelURL_3 value="bar_url_sub.html#four">
<param name=labelURL_4 value="bar_url_sub.html#five">
</applet>
The parameter urltarget, urltarget_N, urltarget_N_M adds a target window where the new web page should be opened. The parameter labelURLTarget and labelURLTarget_N specifies the target widow for the anywhere labels with URLs. The default behavior is to open the new page in the same window.
The different parameter values are:
_self: Open new page in same window or frame.
_parent: Open in the parent window.
_top: Open in the top-level window.
_blank:Open in a new blank window.
name:Open in the frame or window with the specified name.
Use the singleClickURLOn parameter to use single click drilldowns.
The sizing of the pie is calculated based on the size and position of other elements in the chart and the pie height relative to its width. For a pie to have the same width in 2D and 3D, you can set the graphInsets parameter.
<applet code=com.objectplanet.chart.ChartApplet
archive=chart.jar width=200 height=140 VIEWASTEXT>
<param name=sampleValues value="10,20,30,40,50">
</applet>
<applet code=com.objectplanet.chart.ChartApplet
archive=chart.jar width=200 height=140 VIEWASTEXT>
<param name=sampleValues value="10,20,30,40,50">
<param name=3dModeOn value=true>
<param name=angle value=60>
<param name=depth value=0.1>
</applet>
<applet code=com.objectplanet.chart.ChartApplet
archive=chart.jar width=200 height=140 VIEWASTEXT>
<param name=sampleValues value="10,20,30,40,50">
<param name=3dModeOn value=true>
<param name=angle value=60>
<param name=depth value=0.1>
<param name=graphInsets value="-1,40,-1,40">
</applet>
Color names:
black, blue, cyan, darkGray, gray, green, lightGray, magenta, orange,
pink, red, white, yellow