 |
|
|
 Do you know what's really travelling through your
network?
Are you having problems finding sources of network slowdowns?
Do you know what's really travelling through your
network?
Are you having problems finding sources of network slowdowns?
This network monitor and protocol analyzer is the
ultimate application for traffic-level
network monitoring,
troubleshooting, analysis, and visualization.
If your network is crawling to a standstill, and you suspect there might
be a problem with the network traffic, Network Probe will quickly help you
identify what is causing the problem, show you who is generating
the troublesome traffic, and where the traffic is being transmitted
or received.
Search
Using the search feature in Network Probe hosts and protocols of interest can easily be found.
While typing in the search field, Network Probe will suggest hosts and protocols found on your network.
The entries suggested by Network Probe are sorted by bytes.

[click to enlarge]
Once the host or protocol of interest is found details for entry can be shown.
For hosts the top protocols and the top conversations can be shown, for protocols
the top hosts and the top conversations can be shown.
[click to enlarge]
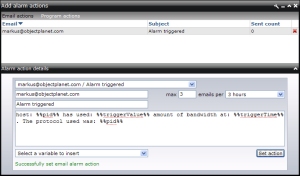
Alarms
Network Probe lets you add monitored alarms on individual protocols, hosts,
conversations, network cards, and any other entity monitored by the probe. You can define any number of
alarms on any monitored entity and define its attributes such as description, severity, thresholds, etc.

[click to enlarge]
Configure Network Probe to automatically send you emails or start programs when alarms are triggered using the add alarm
action feature.
Network summary
Network Probe displays the total
throughput
for the network being monitored, and the number of bytes, packets,
hosts, conversations,
protocols,
and network cards on your network.
You can also see the throughput for packets, and the compounded number of hosts, conversations, protocols,
and network cards.

[click to enlarge]
Top protocols, talkers, listeners, and conversations
Network Probe will quickly show you the most active protocols, talkers, listeners,
hosts, and conversations. You can select the length of the top lists, the sorting,
and which counter it should be listed by. You can also display the throughput for each entry.

[click to enlarge]

[click to enlarge]
User-selected protocols, hosts, and conversations
Select a list of your own protocols, hosts, and conversations to be monitored
and keep an eye on activity you feel is important on your network.

[click to enlarge]
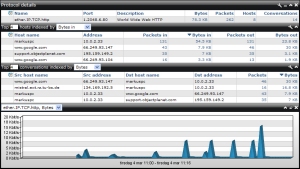
Detailed protocol statistics
Network probe will let you see all the
network protocols
in use use on your network.
It will show you the protocol names, ports, and descriptions, the amount
of traffic seen, the throughput, and the number of hosts and conversation
using each protocol.

[click to enlarge]
See who is using your network
See detailed statistics of every host sending and receiving traffic on your network.
Network Probe will show you host names,
IP addresses,
packets and bytes transmitted
and received, the number of protocols used by each host, the number of
conversations each host has participated in, and the bandwidth usage for
each one.

[click to enlarge]
See conversations on your network
You can see statistics of where each host is receiving data from or transmitting data to.
Network Probe will collect source and destination host names and ip addresses for each
conversation taking place on your network. It will display the number of packets and bytes
transmitted, and the bandwidth usage for each conversation.

[click to enlarge]
Network segment overview
See the throughput for the entire network and the packet size distribution.

[click to enlarge]
|
|
|
|
|
|

;)
;)
;)
;)
;)
;)
;)
;)
;)
;)
;)
;)
;)